Combining classes, online data example
from pathlib import Path
import fnmatch

import numpy as np
from obspy.clients.fdsn import Client
from obspy.core import UTCDateTime
from obspy.core.stream import read
from obspy.core.inventory import read_inventory
from matplotlib import pyplot as plt

from tiskitpy import Decimator, CleanRotator, SpectralDensity, DataCleaner

client_address = 'IRIS'
net = 'Z5'
sta = 'BB650'  # Trillium T240. 100 sps
loc = '*'
cha = 'HH*,HDH'
starttime = UTCDateTime('2014-01-01T')
endtime = UTCDateTime('2014-01-02T')

# READ WAVEFORM DATA ONLINE
fname=f'data/{net}.{sta}.{starttime.strftime("%Y%m%d")}'
client = Client(client_address)
if Path(fname).is_file():   # IF YOU'VE ALREADY DOWNLOADED, DON'T DOWNLOAD AGAIN
    print(f'reading data from file "{fname}"')
    stream = read(fname, "MSEED")
else:
    print('reading data from FDSN server (should take a long time...)')
    stream = client.get_waveforms(network=net, station=sta, channel=cha,
                                  location=loc, starttime=starttime,
                                  endtime=endtime)
    Path(fname).parent.mkdir(exist_ok=True)
    stream.write(fname, "MSEED")  # COMMENT OUT ONCE YOU'VE READ FROM FDSN!!!!!

# READ INVENTORY ONLINE
fname=f'data/{net}.{sta}.{starttime.strftime("%Y%m%d")}.station.xml'
if Path(fname).is_file():  # IF YOU'VE ALREADY DOWNLOADED, DON'T DOWNLOAD AGAIN
    print(f'reading inventory from file "{fname}"')
    inv = read_inventory(fname, "STATIONXML")
else:
    print('reading inventory from FDSN server (could take a long time...)')
    inv = client.get_stations(starttime=starttime, endtime=endtime,
                          network=net, station=sta, channel='*', location='*',
                          level='response')
    Path(fname).parent.mkdir(exist_ok=True)
    inv.write(fname, "STATIONXML")

# DECIMATE DATA DOWN TO 1 Hz
decim = Decimator([5, 5, 4])
stream_decim = decim.decimate(stream)
inv_decim = decim.update_inventory(inv, stream)
[INFO] Decimating data from 100 to 1 Hz (100x)...
[INFO] Took 0.6 seconds
[INFO] Decimating data from 100 to 1 Hz (100x)...
[INFO] Took 0.5 seconds
[INFO] Decimating data from 100 to 1 Hz (100x)...
[INFO] Took 0.5 seconds
[INFO] Decimating data from 100 to 1 Hz (100x)...
[INFO] Took 0.5 seconds
[INFO] New data has [86401, 86401, 86401, 86401] samples
 WARNING: FIR normalized: sum[coef]=9.767192E-01;
[INFO] channel modified from Z5.BB650..HDH (100.0 sps) to Z5.BB650..LDH (1 sps)
 WARNING: FIR normalized: sum[coef]=9.767192E-01;
[INFO] channel modified from Z5.BB650..HH1 (100.0 sps) to Z5.BB650..LH1 (1 sps)
 WARNING: FIR normalized: sum[coef]=9.767192E-01;
[INFO] channel modified from Z5.BB650..HH2 (100.0 sps) to Z5.BB650..LH2 (1 sps)
 WARNING: FIR normalized: sum[coef]=9.767192E-01;
[INFO] channel modified from Z5.BB650..HHZ (100.0 sps) to Z5.BB650..LHZ (1 sps)
sd_orig = SpectralDensity.from_stream(stream_decim, inv=inv_decim)
[INFO] Didn't find local EQ file '20140101-20140102_MM5.85_eqcat.qml', reading from USGS online catalog...
[INFO] Done
[INFO] writing catalog to "20140101-20140102_MM5.85_eqcat.qml"
# USE SIMPLE ROTATION TO REDUCE VERTICAL CHANNEL NOISE
rotator = CleanRotator(stream_decim)
rot_stream = rotator.apply(stream_decim)
sd_rot = SpectralDensity.from_stream(rot_stream, inv=inv_decim)
[INFO] CleanRotator: angle, azimuth, var_red = 0.12, 241.5, 0.97
# USE TRANSFER FUNCTION BASED DATA CLEANER TO REDUCE VERTICAL CHANNEL NOISE
dc = DataCleaner(rot_stream, ['*1', '*2', '*H'])
# first clean the stream, then calculate the spectral density
rot_stream_dc = dc.apply(rot_stream)
sd_rot_dc = SpectralDensity.from_stream(rot_stream_dc, inv=inv_decim)
# directly calculate the spectral density, with the datacleaner as input
sd_rot_sddc = dc.apply_to_streams_sdf(rot_stream, inv=inv_decim)
 WARNING: FIR normalized: sum[coef]=9.767192E-01;
 .
 .
 .
[INFO] z_threshold=3, rejected 4% of windows (3/84)
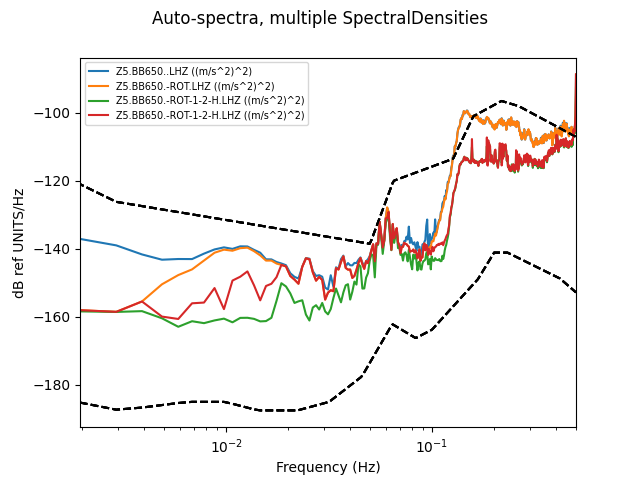
# PLOT THE RESULTS
SpectralDensity.plots(
    (sd_orig, sd_rot, sd_rot_dc, sd_rot_sddc),
    channel='LHZ')
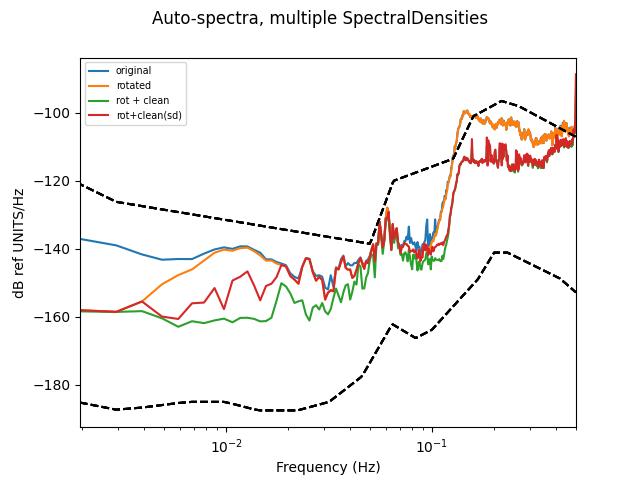
# PLOT THE RESULTS WITH CUSTOM LABELS
SpectralDensity.plots(
    (sd_orig, sd_rot, sd_rot_dc, sd_rot_sddc),
    labels=('original', 'rotated', 'rot + clean', 'rot+clean(sd)'),
    channel='LHZ')