Combining classes
import fnmatch

import numpy as np
from obspy.core.stream import read
from obspy.core.inventory import read_inventory
from matplotlib import pyplot as plt

from tiskitpy import CleanRotator, SpectralDensity, DataCleaner

# Read data and metadata, and calculate a SpectralDensity
stream = read('data/XS.S11D.LH.2016.12.11.mseed', 'MSEED')
inv = read_inventory('data/XS.S11_decimated.station.xml', 'STATIONXML')
sd_orig = SpectralDensity.from_stream(stream, inv=inv)
[INFO] z_threshold=3, rejected 4% of windows (3/84)
# USE SIMPLE ROTATION TO REDUCE VERTICAL CHANNEL NOISE
rotator = CleanRotator(stream)
rot_stream = rotator.apply(stream)
sd_rot = SpectralDensity.from_stream(rot_stream, inv=inv)
[INFO] CleanRotator: angle, azimuth, var_red =  0.09,  212.3, 0.75

[INFO] z_threshold=3, rejected 4% of windows (3/84)
# USE RESPONSE FUNCTION BASED DATA CLEANER TO REDUCE VERTICAL CHANNEL NOISE
dc = DataCleaner(stream, ['*1', '*2', '*H'])
dc_rot = DataCleaner(rot_stream, ['*1', '*2', '*H'])
[INFO] z_threshold=3, rejected 4% of windows (3/84)
[INFO] z_threshold=3, rejected 4% of windows (3/84)
[INFO] z_threshold=3, rejected 4% of windows (3/84)
[INFO] z_threshold=3, rejected 4% of windows (3/84)

[INFO] z_threshold=3, rejected 4% of windows (3/84)
[INFO] z_threshold=3, rejected 4% of windows (3/84)
[INFO] z_threshold=3, rejected 4% of windows (3/84)
[INFO] z_threshold=3, rejected 4% of windows (3/84)
# Clean the stream and calculate its spectral density
stream_dc = dc.apply(stream)
rot_stream_dc = dc_rot.apply(rot_stream)
sd_dc = SpectralDensity.from_stream(stream_dc, inv=inv)
sd_rot_dc = SpectralDensity.from_stream(rot_stream_dc, inv=inv)
[INFO] Correcting traces in the frequency domain
[INFO] Correcting traces in the frequency domain
[INFO] z_threshold=3, rejected 6% of windows (5/84)
[INFO] z_threshold=3, rejected 6% of windows (5/84)
# Directly calculate the spectral density from the DataCleaner
sd_rot_sddc = dc_rot.apply_to_streams_sdf(rot_stream, inv=inv)
[INFO] z_threshold=3, rejected 4% of windows (3/84)
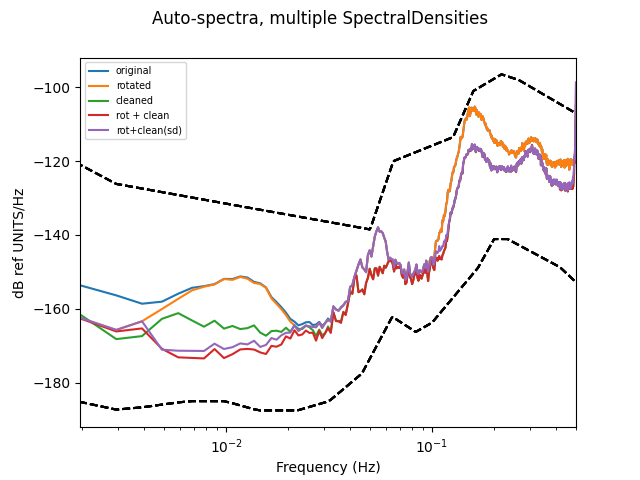
# PLOT THE RESULTS
SpectralDensity.plots(
    [sd_orig, sd_rot, sd_dc, sd_rot_dc, sd_rot_sddc],
    labels=['original', 'rotated', 'cleaned', 'rot + clean', 'rot+clean(sd)'],
    channel='LHZ')